Post-occupancy evaluations give us the feedback we need to advance our design.
Our involvement with a project doesn’t stop when the ribbon is cut. Because we’re always looking to learn and improve, we want to understand how our buildings and places are functioning for their users. This is where post-occupancy evaluations (POEs) come in—they close the loop between design intent and real-world performance.
In addition to advancing our practice, POEs provide valuable information to our clients. They show how decisions made during the design process are playing out for users, highlight non-design issues that can be addressed immediately, and help prioritize for future capital projects.
When paired with stakeholder engagement, POEs create a continuous cycle of input, feedback, and learning that strengthens every project.
What is Post-Occupancy Evaluation?
POE is the process of gathering data, opinions, and insights on a building’s performance after it’s occupied. This information can take many forms, ranging from hard numbers to personal impressions. Data may be solicited directly from users or drawn from external sources like utility companies. Because every project has unique goals, we use a wide variety of methods depending on what we want to learn.
Methods of Post-Occupancy Evaluation
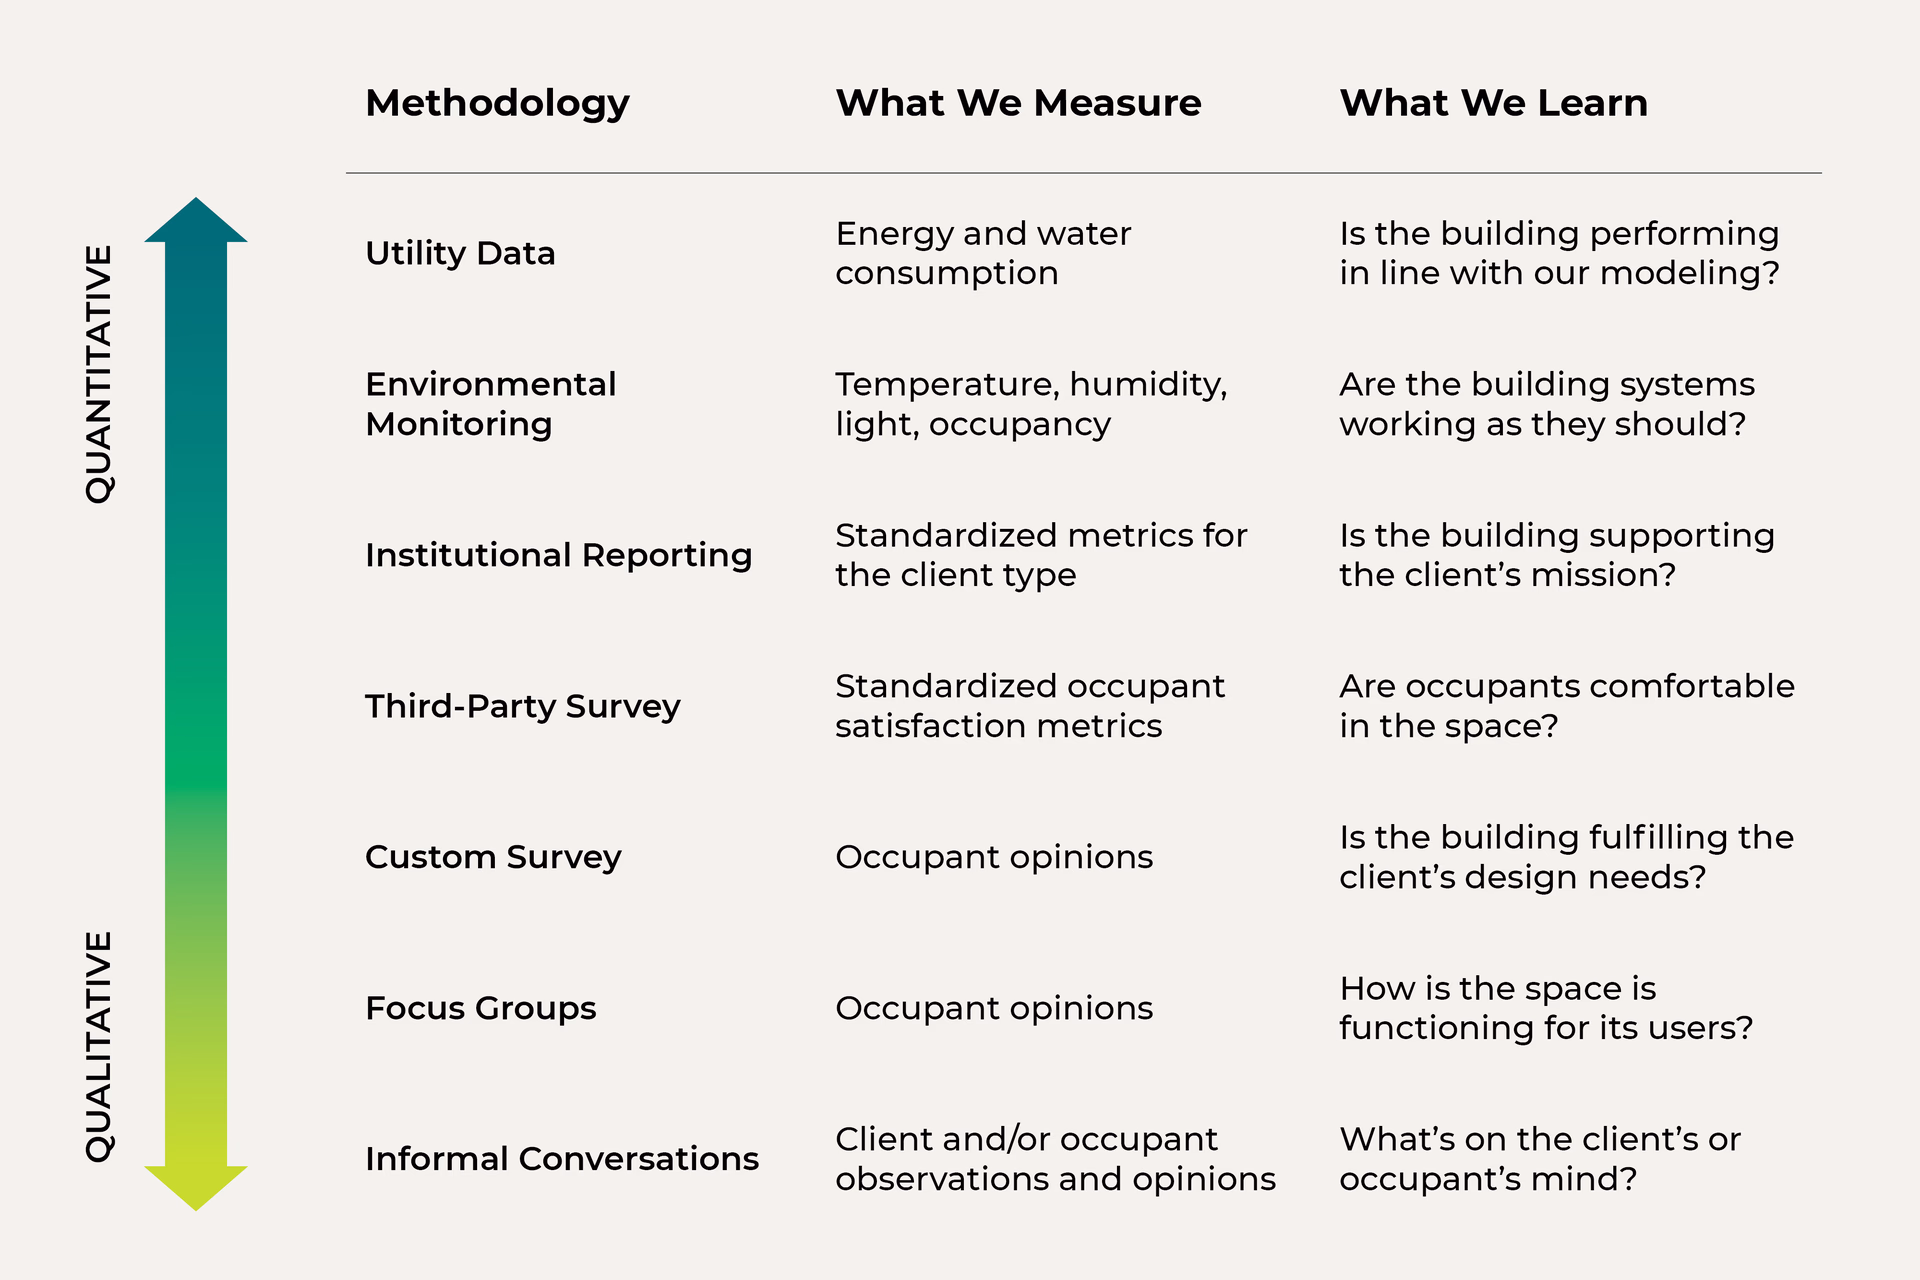
We tailor our methods to the aspect(s) of performance we’re evaluating. For example, a quantitative approach results in hard numbers, while a qualitative one yields insight into users’ experiences and feelings. Surveying a large number of building users shows more perspectives than having a conversation with just a few key staff. However, if we’re looking at a specialized topic like ease of maintenance, it’s the custodial and facilities staff’s perspective that matters most. When we’re evaluating the building’s overall performance, a combination of methods gives us the most complete picture.
UTILITY DATA
One of the most objective methods is analyzing utility data. By reviewing energy and water consumption from utility statements, we can determine whether the building is performing as intended. This approach is straightforward and free from bias, but it doesn’t explain why usage differs from projections. It also doesn’t provide any information about the occupant experience—are occupants happy with the temperature, lighting quality, or water pressure?
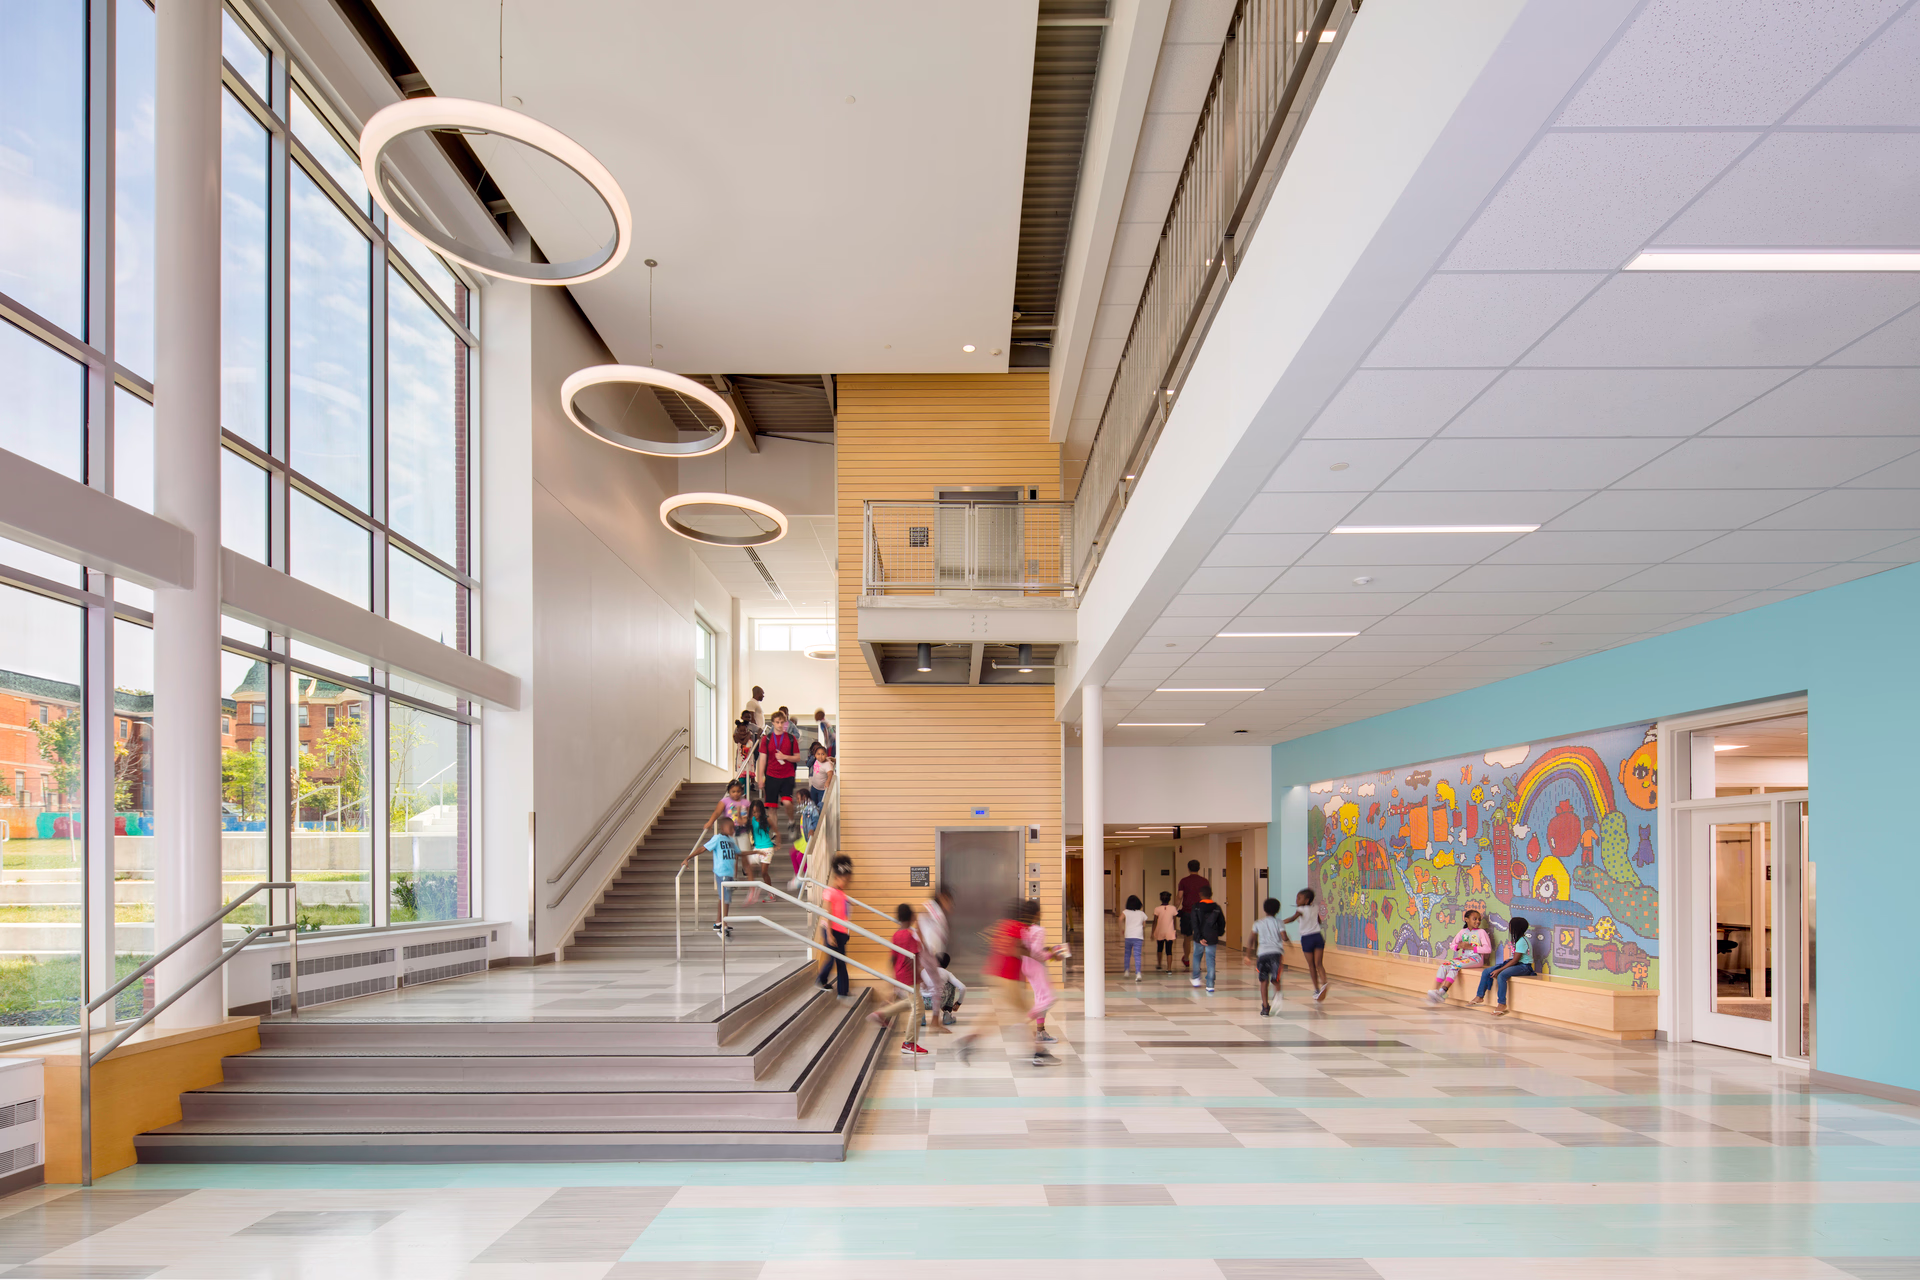
At McKinley Middle School, utility data revealed that our renovation significantly reduced energy use, in line with what our modeling had predicted. The building’s energy use intensity (EUI) dropped from 103 kBtu/sf/yr to 50 kBtu/sf/yr. Along with other sustainable design strategies, this decrease helped the school attain LEED Platinum certification—and halved its energy costs.
ENVIRONMENTAL MONITORING
Environmental monitoring is another method that yields quantitative data. Sensors installed throughout the building measure qualities like temperature, humidity, air quality, lighting levels, and occupancy patterns. This provides granular data on individual spaces and shows changes over time. However, knowing the temperature doesn’t tell us whether people are comfortable at that temperature, and setting up and maintaining sensors requires effort.
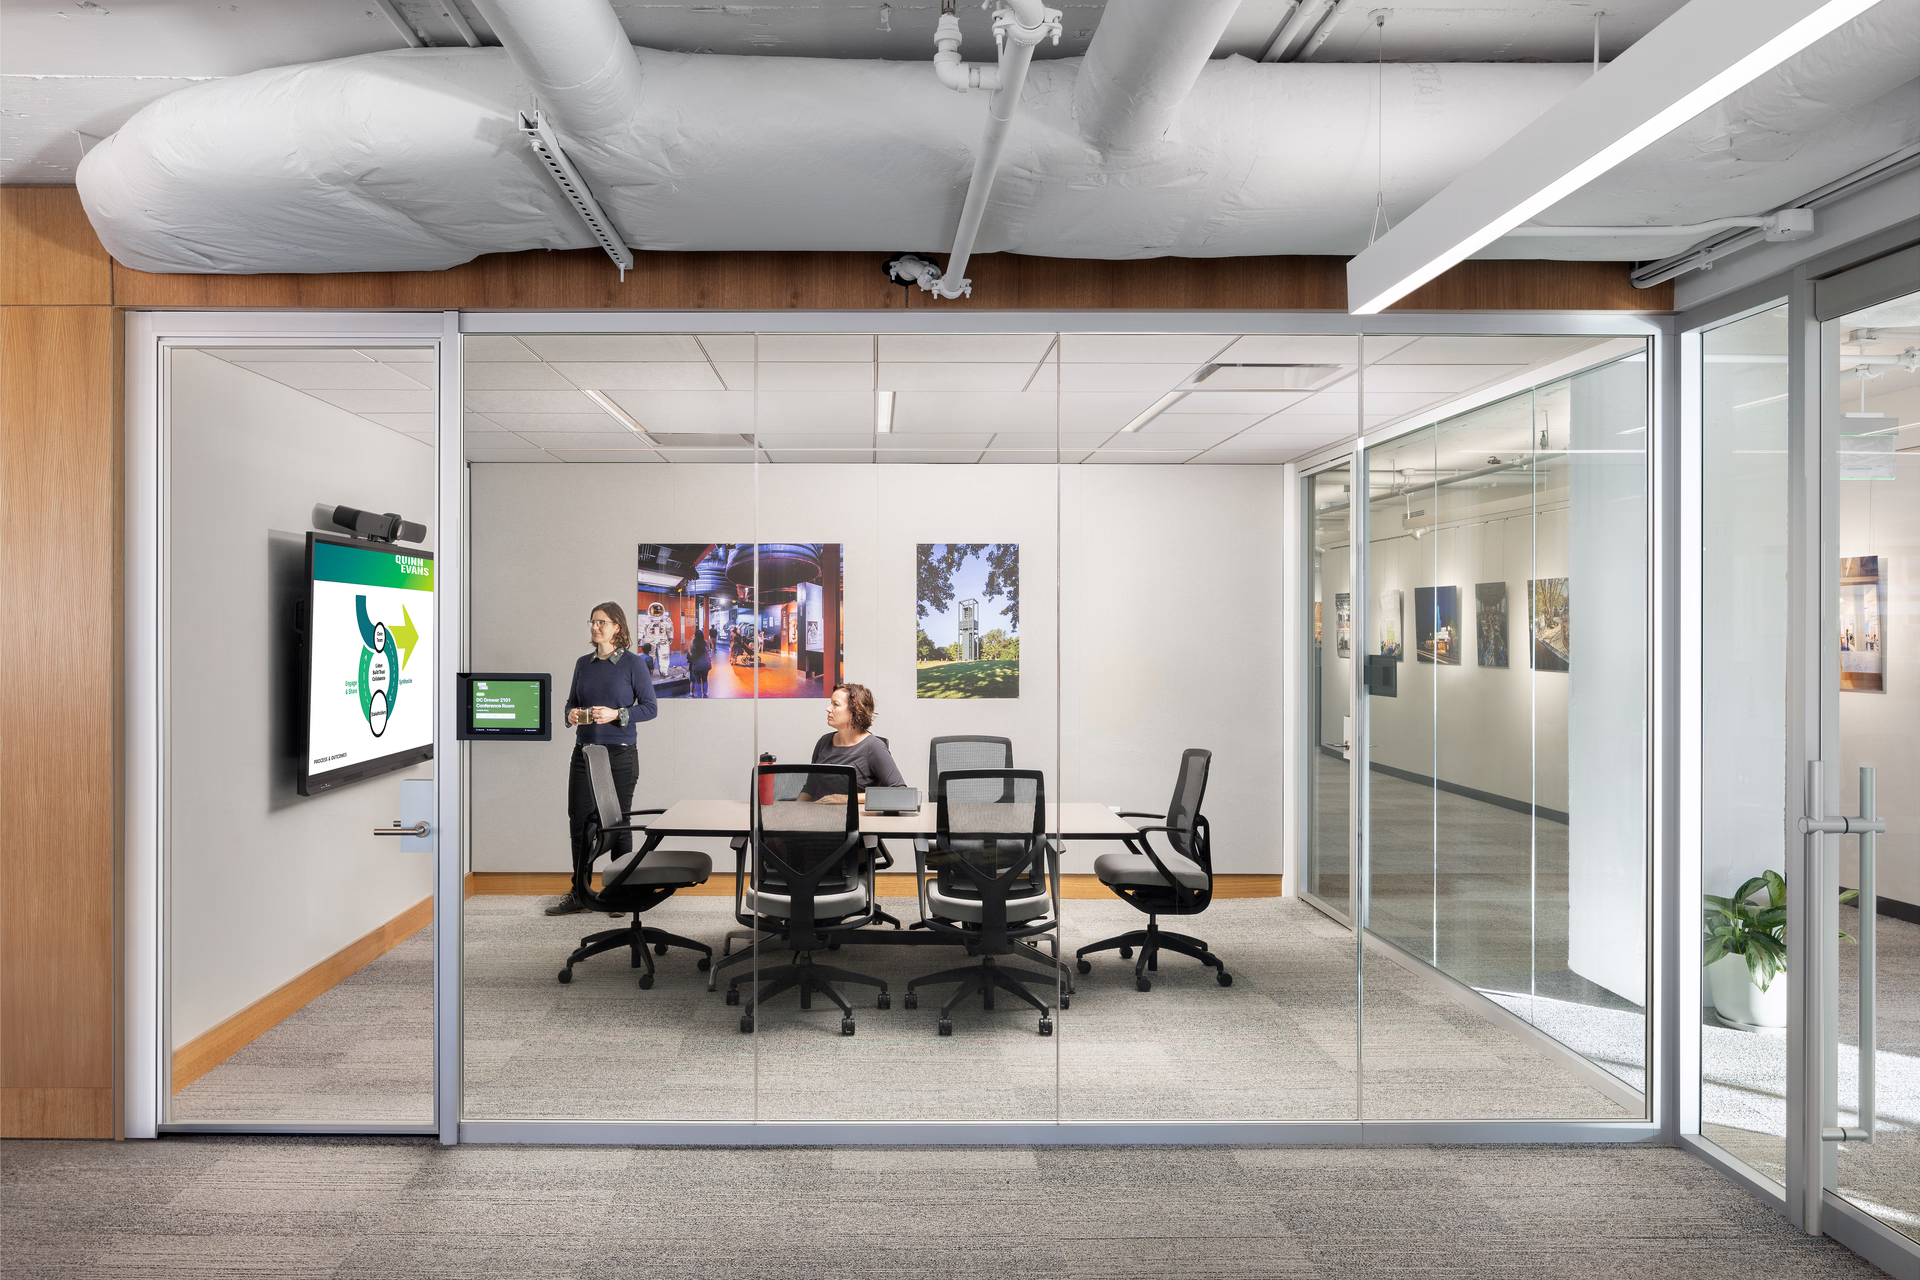
The digital twin we created for our Washington, DC, office incorporates data from light sensors throughout our suite. This data validates our decision to use glazed rather than opaque walls at conference rooms, which allows daylight from perimeter windows to reach deeper into the space. Combined with sensor-driven electric lighting that only turns on when needed, the glazed walls are reducing our energy use and costs.
INSTITUTIONAL REPORTING
Institutional reporting offers a different perspective. Many of our clients provide annual reports to the public, municipalities, organizations from which they’ve received grants, or bodies like the Institute of Museum and Library Services. This documentation may include metrics like program attendance, graduation rates, or absenteeism. Comparing figures from before and after a capital project can reveal its impact.
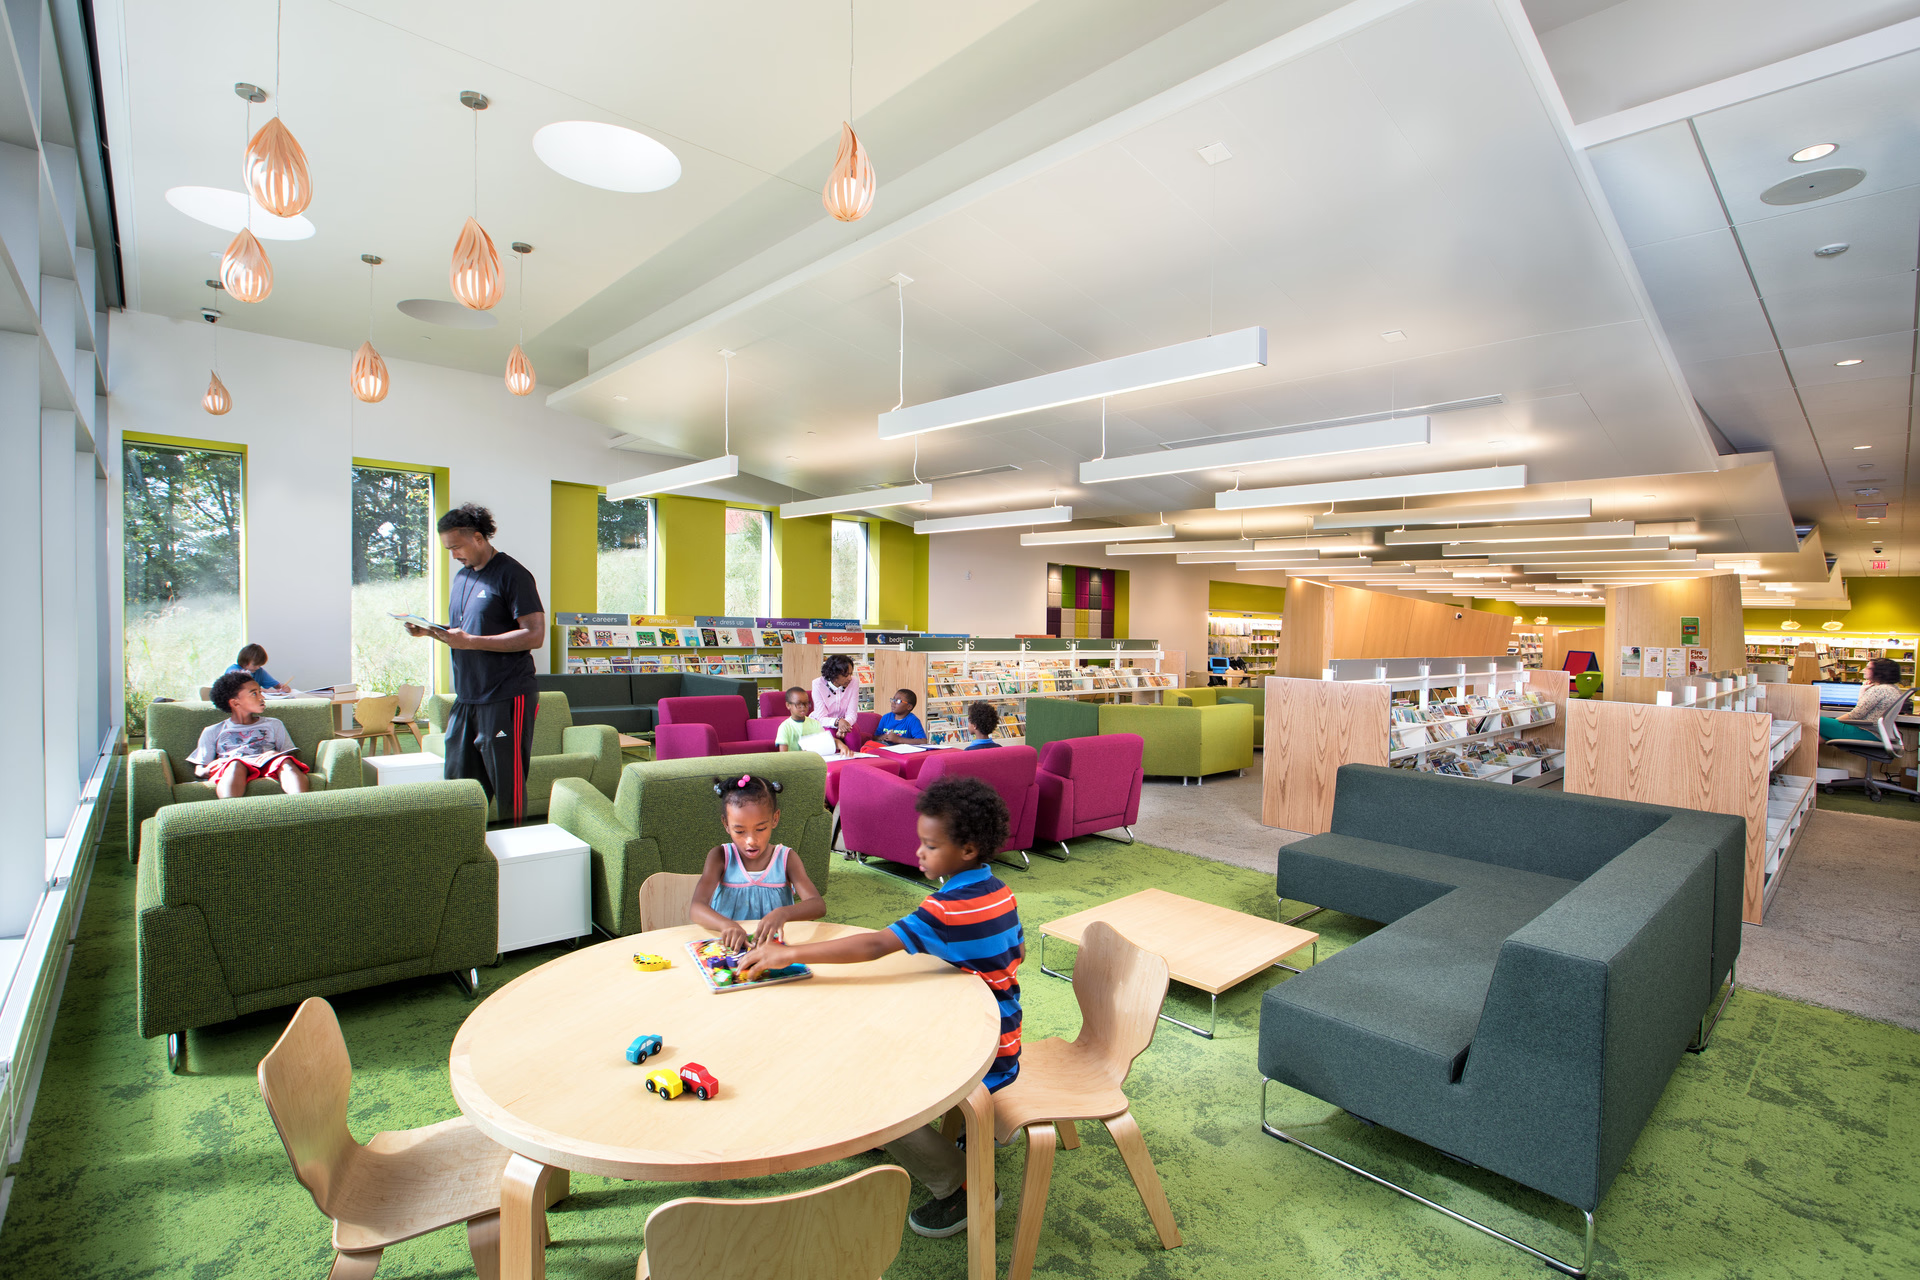
Varina Library’s reporting for the national Public Libraries Survey shows that engagement at the new library is much higher relative to the building it replaced, with a 121% increase in circulation, 211% increase in visitors, and 301% increase in program participation. In each category, the growth exceeded the average of all Henrico County Public Library branches during the same period.
THIRD-PARTY SURVEYS
Surveys solicit qualitative information from building occupants; through them, we seek to understand how users feel about the building. A third-party survey is one designed and administered by an outside organization, not us or the client. These surveys present a standard set of questions that are scientifically designed to minimize bias. They can be distributed widely among building users, and the anonymity of responses encourages candor.
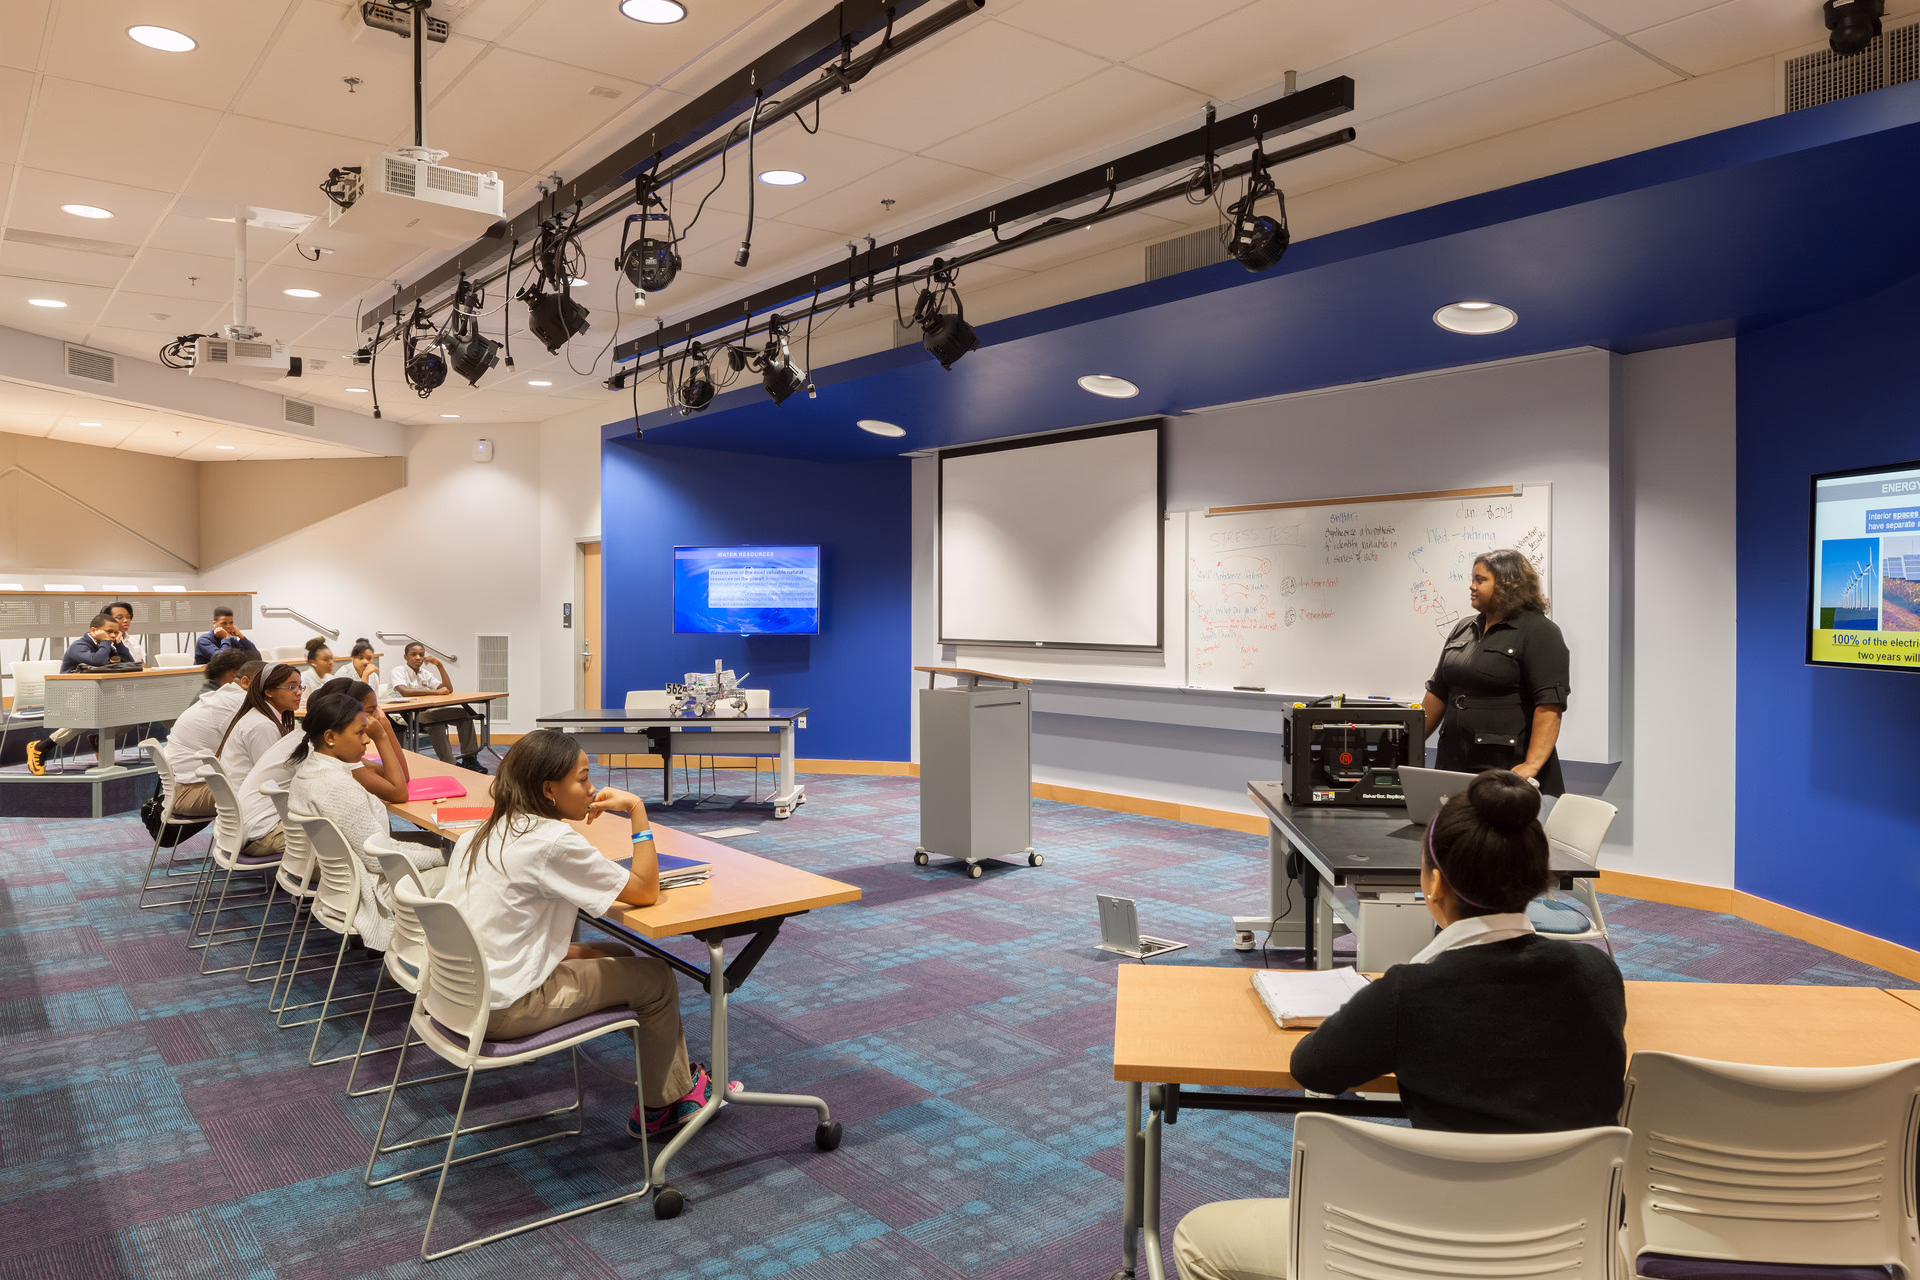
We have partnered with the Center for the Built Environment (CBE), a research center at the University of California, Berkeley, to implement the CBE Occupant Survey for several projects—and compare the results to CBE’s benchmarking database of similar buildings around the world. CBE’s survey of teachers and staff at Dorothy I. Height Elementary School recorded high marks for daylighting, acoustics, and accessibility within the building. However, it also revealed that staff wanted operable windows and vents in the wake of the Covid-19 pandemic, which began after the school was completed. While a tightly controlled building envelope is preferable for engineering performance, occupant comfort (both physical and psychological) should be a key consideration in systems optimization.
CUSTOM SURVEYS
Custom surveys are tailored to the client’s specific questions and needs. They can address any aspect of a building’s functioning, from comfort to aesthetics, and if responses aren't anonymous, we can follow up with clarifying questions. The trade-off is the effort required to collect, analyze, and interpret the results.
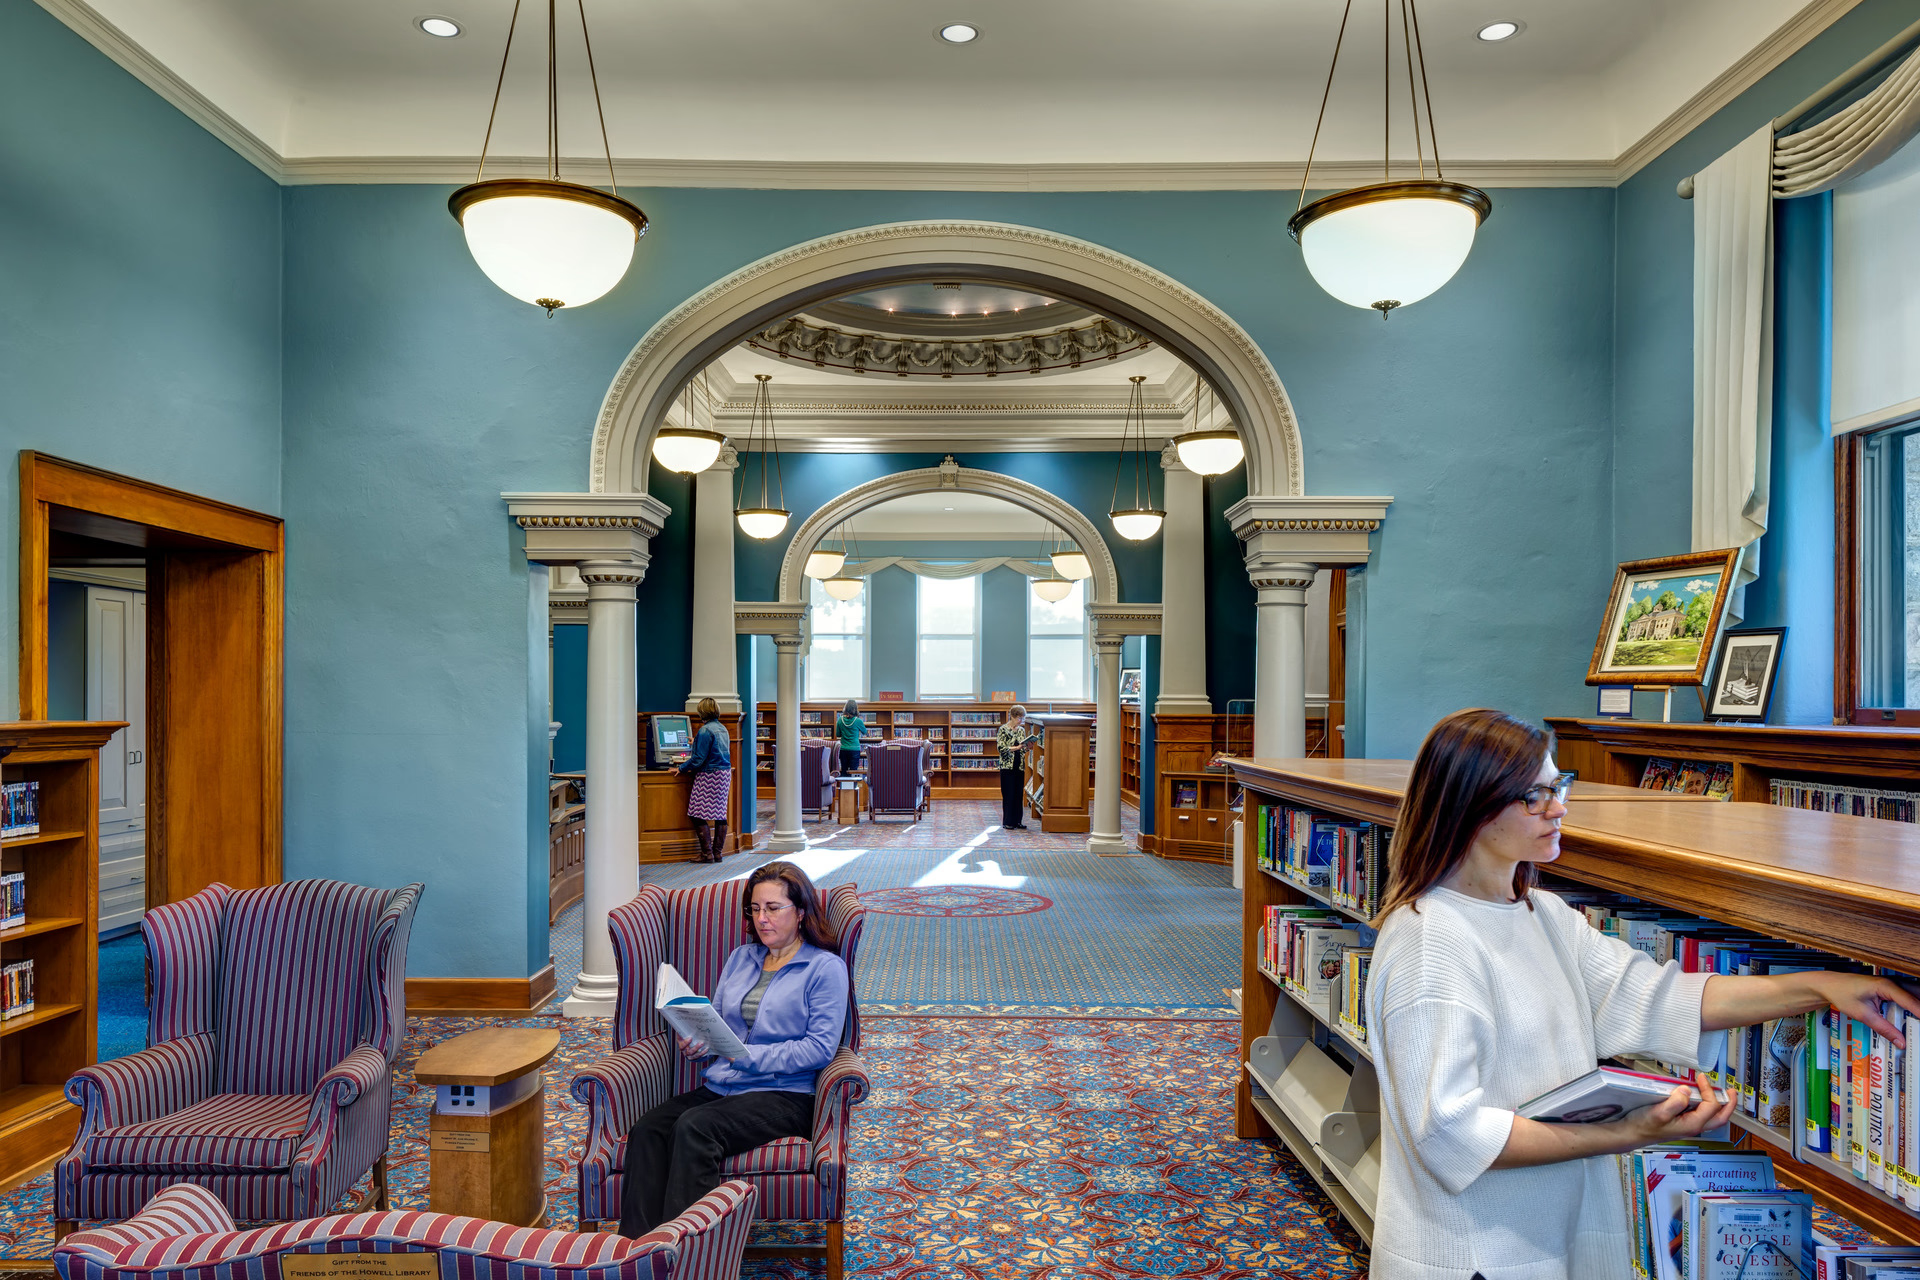
From a survey we designed for Howell Carnegie District Library in Howell, Michigan, we learned that staff feel patrons are well served by our renovation, with 100% of respondents agreeing that patrons have comfortable spaces to read, relax, study, and work—although they find some of the furniture too heavy to easily reconfigure for different program types. While we didn’t anticipate the furniture being moved around frequently, this feedback serves as a reminder that future flexibility should always be on our radar.
FOCUS GROUPS AND INTERVIEWS
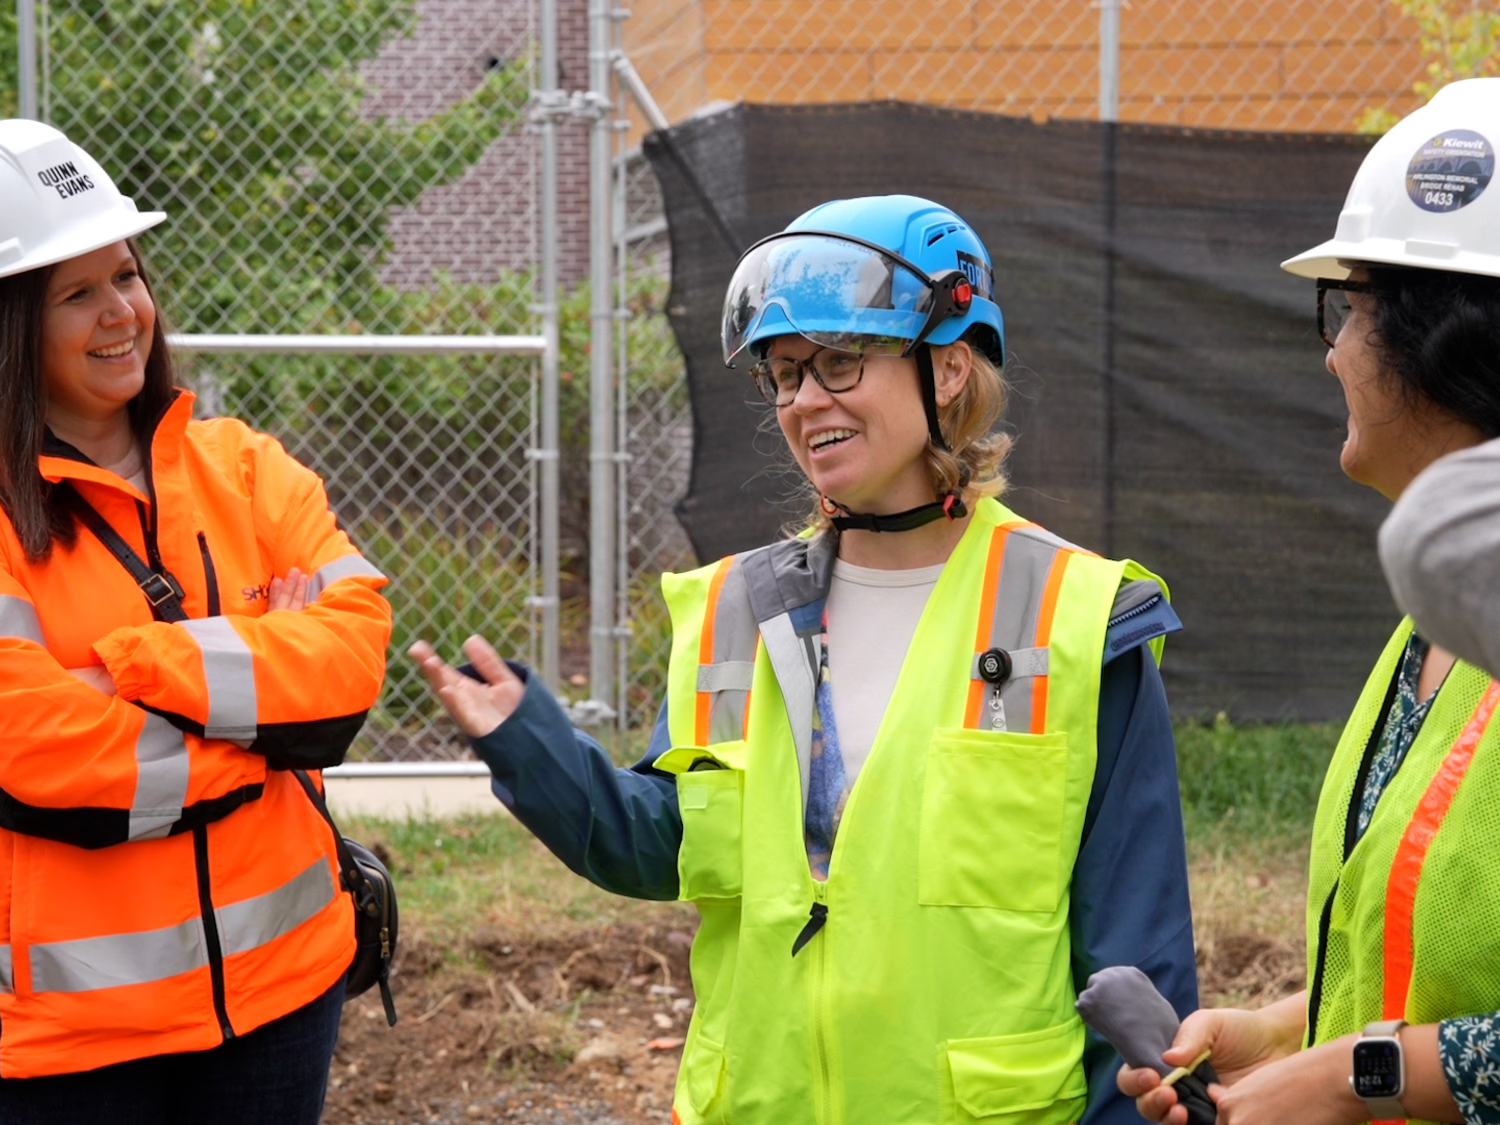
Focus groups offer rich, conversation-driven feedback. By inviting selected individuals to in-person or virtual discussions, we gain insight into user experiences and preferences. Observational walkthroughs, where we tour the space with client representatives, provide direct observations of building use and occupant behavior. While these methods yield deep insights, they involve a limited number of participants by necessity.
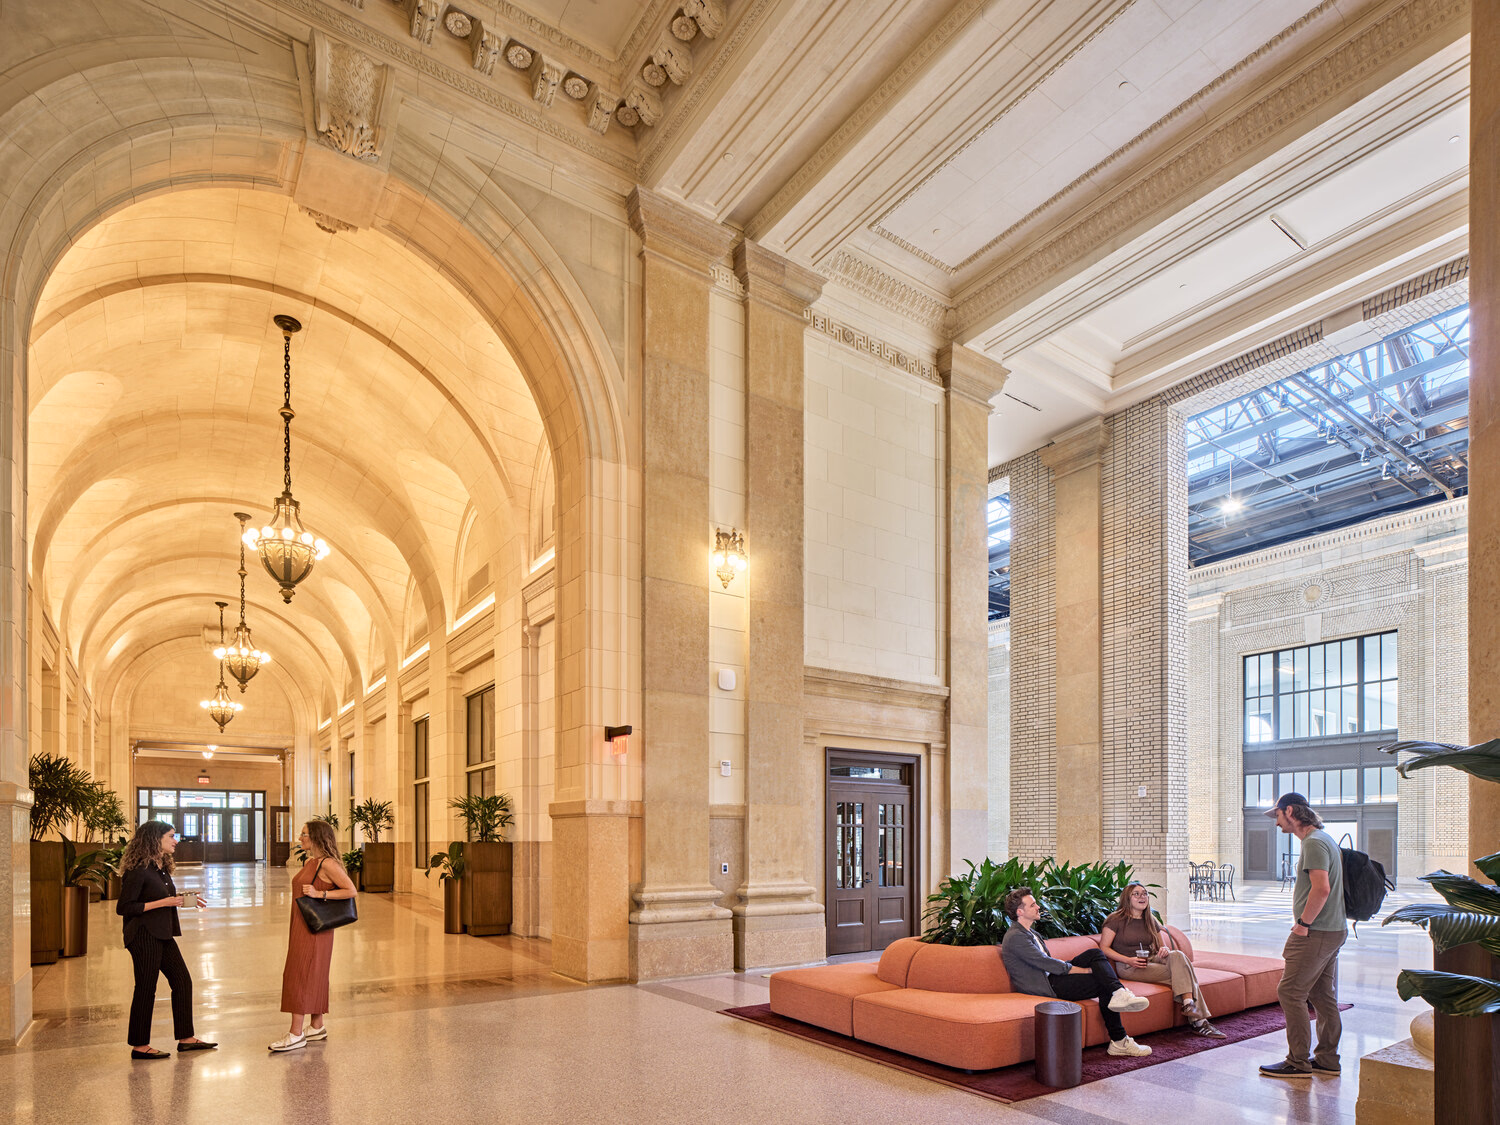
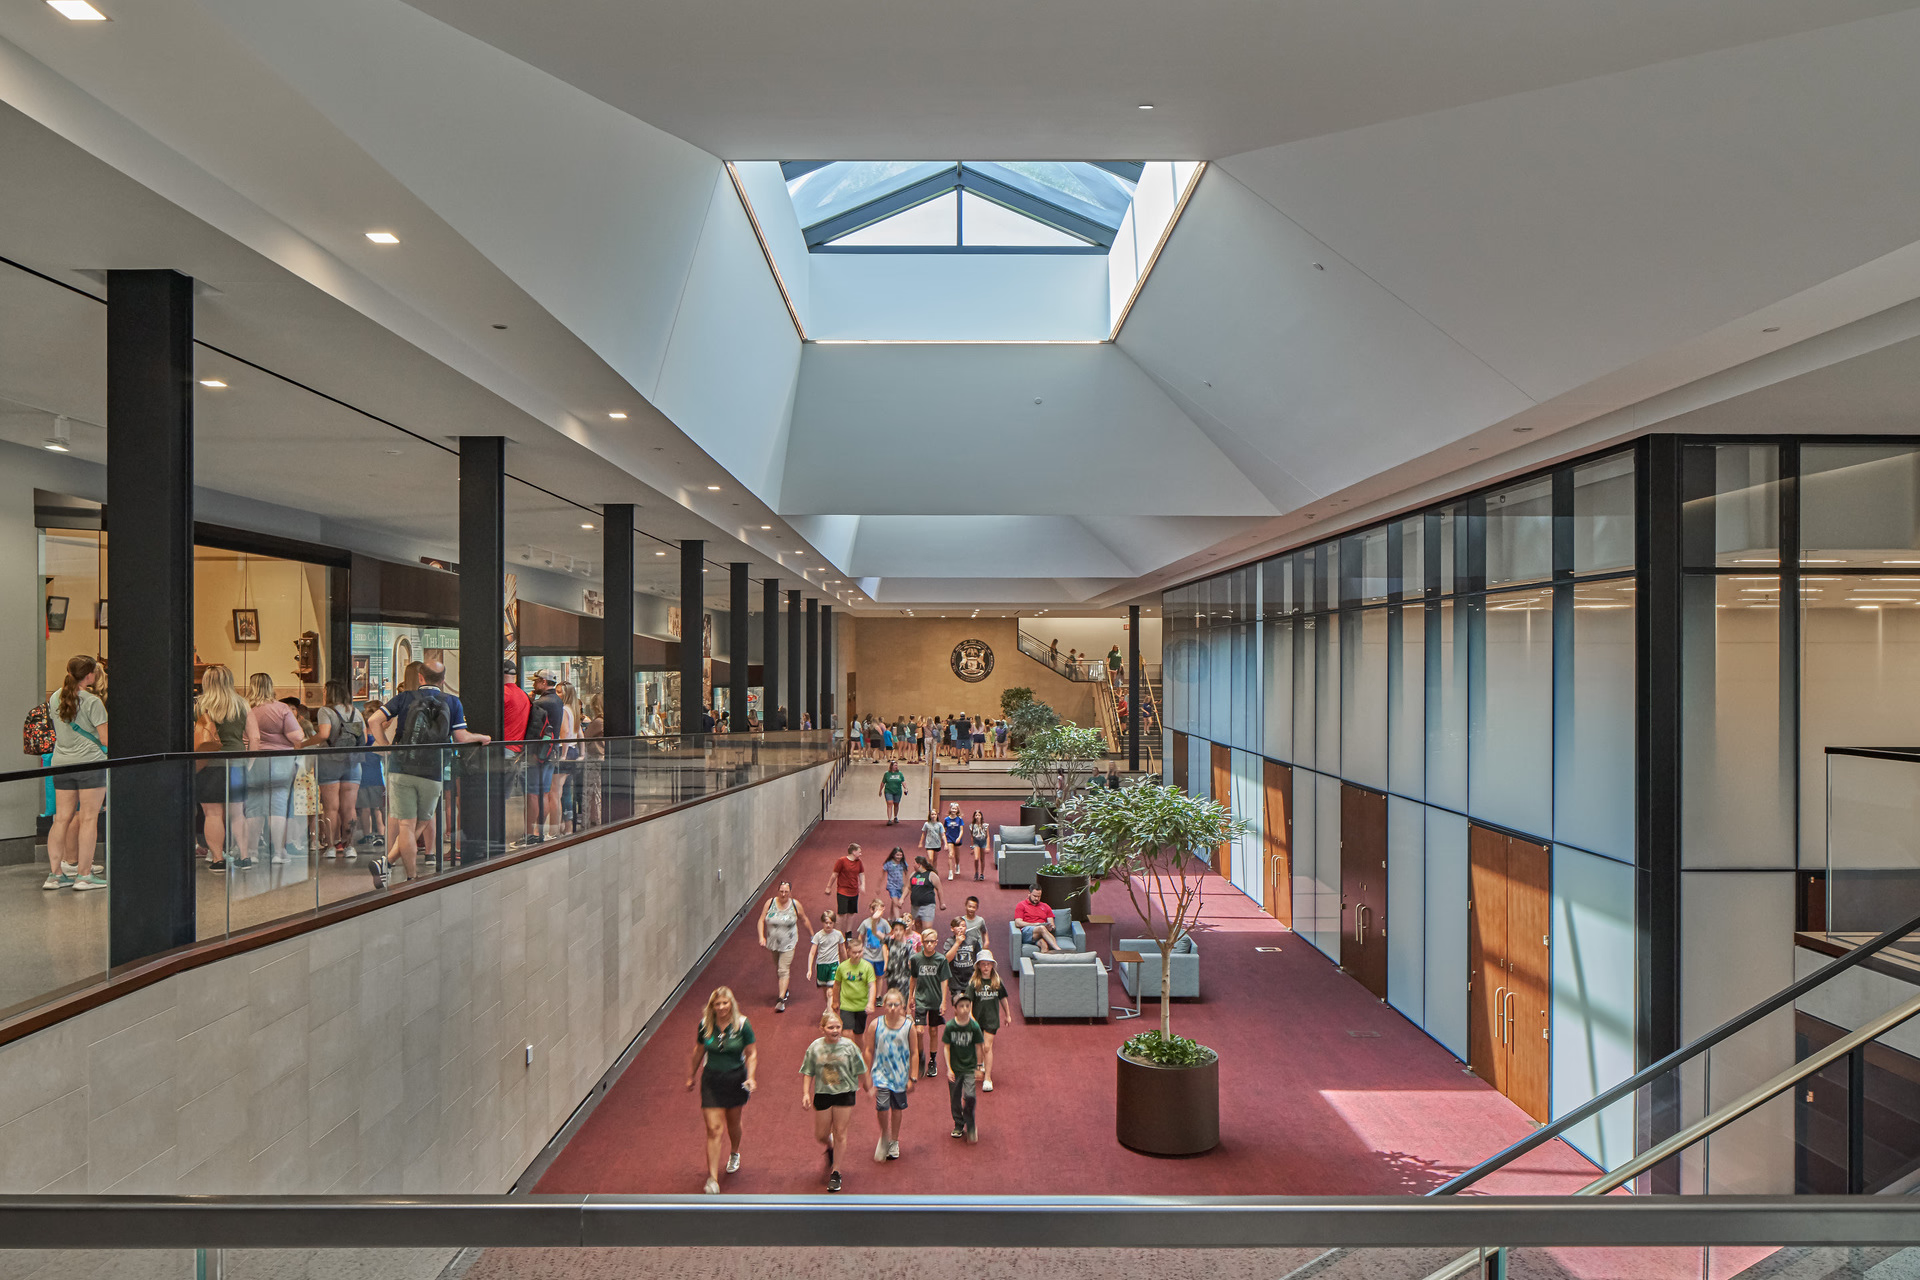
By convening small-group conversations with key staff at Heritage Hall, we learned that the atrium, which we designed as a circulation and pre-function space, is being used as an event space in its own right. This is due to the popularity of the adjacent State Rooms, which are receiving more bookings and generating more revenue than anticipated. Staff have adapted by directing attendees to secondary State Room entries when multiple events are taking place at once.
Design, Assess, Learn, Repeat
POEs help us and our clients understand how the decisions we made during design translate into real-world performance. For clients managing multiple facilities, such as school districts or library systems, POEs turn project experience into actionable strategy. For our team, they’re a cornerstone of our design process, fueling continuous improvement by giving us the feedback we need to ensure each design is more effective than the last.
.avif)
.avif)